
It’s been an uncomfortable ride in equity markets this year. The S&P 500 entered bear market territory in June, after falling more than 20% below its January 3rd peak. For investors, this sort of steep decline in stocks might reduce their confidence in markets. They may start to feel they could be better off holding cash and waiting for greener pastures. But for the long-term investor, it’s important to remember that some of the strongest returns in equity markets can come hard on the heels of their worst moments.
Rock bottom… or a spring board?
Since the start of the millennium, there have been three periods where stocks declined more than 20% from their peak and one further close call in 2018. As the charts below show, their rebound off the lows was very steep and rapid. While we can never know when exactly the stock market will bottom, history suggests investors should want to be there when it happens.
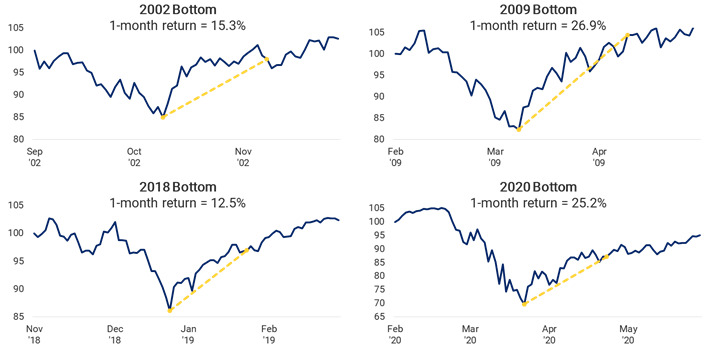
Source: Morningstar, RBC GAM. S&P 500 Total Return Index USD. This graph does not reflect transaction costs, investment management fees or taxes. If such costs and fees were reflected, returns would be lower. An investment cannot be made directly into an index
Key take-aways
- When stocks hit their bottom, they changed direction swiftly.
- One month after bottoming, stocks had delivered double-digit returns in each case.
- The significance of that shouldn’t be understated. In just one month, stocks delivered returns greater than what they would typically achieve over an average year.
Controlling what can be controlled
Over the past few years we have seen a number of disruptive market events that have impacted both stocks and bonds. While uncomfortable to experience, these sort of events are an inevitable part of investing and are out of the control of individual investors.
Investors can take comfort in knowing that the success of their financial plans should have little to do with avoiding periods of poor returns. Since the year 2000, the S&P 500 has returned over 300% (6.4% annualized). That return includes the experiences of the tech wreck, global financial crisis, COVID-19 pandemic and this year’s bear market.
As an investor, the bigger risk to your financial success might be your ability to stay invested through these sort of periods and be there for the strong performance that tends to follow. Thankfully, this is something that is fully within your control.
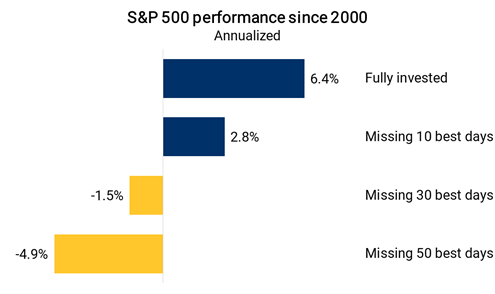
Source: Morningstar, RBC GAM. S&P 500 Total Return Index USD from January 1, 2000 to July 15, 2022. This graph does not reflect transaction costs, investment management fees or taxes. If such costs and fees were reflected, returns would be lower. An investment cannot be made directly into an index.
It’s been an uncomfortable ride in equity markets this year. The S&P 500 entered bear market territory in June, after falling more than 20% below its January 3rd peak. For investors, this sort of steep decline in stocks might reduce their confidence in markets. They may start to feel they could be better off holding cash and waiting for greener pastures. But for the long-term investor, it’s important to remember that some of the strongest returns in equity markets can come hard on the heels of their worst moments.
Rock bottom… or a spring board?
Since the start of the millennium, there have been three periods where stocks declined more than 20% from their peak and one further close call in 2018. As the charts below show, their rebound off the lows was very steep and rapid. While we can never know when exactly the stock market will bottom, history suggests investors should want to be there when it happens.
Source: Morningstar, RBC GAM. S&P 500 Total Return Index USD. This graph does not reflect transaction costs, investment management fees or taxes. If such costs and fees were reflected, returns would be lower. An investment cannot be made directly into an index
Key take-aways
- When stocks hit their bottom, they changed direction swiftly.
- One month after bottoming, stocks had delivered double-digit returns in each case.
- The significance of that shouldn’t be understated. In just one month, stocks delivered returns greater than what they would typically achieve over an average year.
Controlling what can be controlled
Over the past few years we have seen a number of disruptive market events that have impacted both stocks and bonds. While uncomfortable to experience, these sort of events are an inevitable part of investing and are out of the control of individual investors.
Investors can take comfort in knowing that the success of their financial plans should have little to do with avoiding periods of poor returns. Since the year 2000, the S&P 500 has returned over 300% (6.4% annualized). That return includes the experiences of the tech wreck, global financial crisis, COVID-19 pandemic and this year’s bear market.
As an investor, the bigger risk to your financial success might be your ability to stay invested through these sort of periods and be there for the strong performance that tends to follow. Thankfully, this is something that is fully within your control.
Source: Morningstar, RBC GAM. S&P 500 Total Return Index USD from January 1, 2000 to July 15, 2022. This graph does not reflect transaction costs, investment management fees or taxes. If such costs and fees were reflected, returns would be lower. An investment cannot be made directly into an index.